How to Add a Table in Google Slides (2026)
Insert a table in Google Slides via Insert > Table. Set rows and columns, fill cells, and format borders. Step-by-step with screenshots.
Tables organise data into rows and columns - perfect for comparison charts, schedules, or any structured information that doesn't need a full spreadsheet. Google Slides lets you insert a table from Insert > Table, choose the grid size from a 20×20 picker, and fill cells with text or images. Once placed, tables behave like any object: drag to move, click handles to resize, format with the toolbar.
How to insert a table in Google Slides?
1. Click Insert in the top menu.
2. Hover Table to open the size picker.
3. Move the cursor across the grid to set rows × columns, then click to insert.
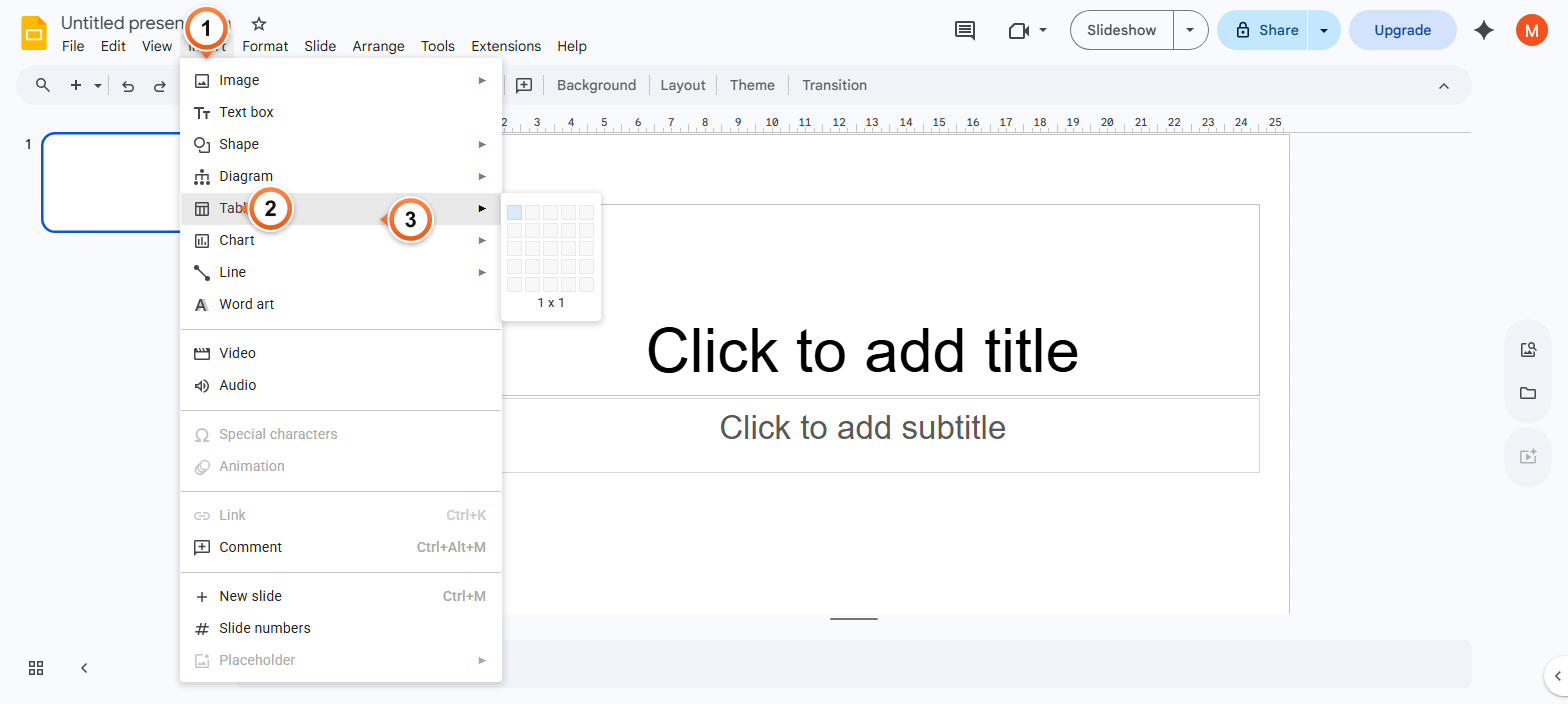
Note: The grid lets you pick up to 20 rows by 20 columns in one drag. Hover over a cell to see the size preview (e.g., 3 × 4) before clicking. For a larger table, insert a 20×20 first then add more rows / columns via right-click.
How to add or remove rows and columns?
1. Click any cell in the table to position your cursor.
2. Right-click and pick Insert row above / below or Insert column left / right.
3. Use Delete row or Delete column from the same menu to remove a row or column.
Note: Tab in the last cell of the last row creates a new row instantly - the fastest way to extend a table while typing. Shift+Tab moves backwards. To delete the entire table, click an edge to select it as an object, then press Delete.
How to format a table - borders, fill, and text?
1. Click and drag across cells to select them.
2. Use the toolbar to change Fill colour, Border colour, Border weight, and text formatting.
3. For preset table styles, right-click and pick Table properties to control alignment and padding.
Note: Header rows often look better with a darker fill colour and white text. Use Format > Table > Distribute rows / columns to make rows or columns equal-width / equal-height in one click - useful after manual cell resizing.
Frequently Asked Questions
What's the maximum table size in Google Slides?
20 rows by 20 columns from the Insert > Table grid. Beyond that, insert the 20×20 max, then right-click to add more rows / columns one at a time. Practical limit: a 20×20 table already feels cramped on a 16:9 slide - if you need more cells, embed a Google Sheet via Insert > Chart > From Sheets instead.
How do I copy a table from Google Sheets into Google Slides?
Two paths. (1) Insert > Chart > From Sheets pastes a live-linked range that updates when the source changes - best for data that evolves. (2) In Sheets, select cells, copy (Ctrl+C), in Slides paste (Ctrl+V) and pick Paste link to spreadsheet for live link, or Paste unlinked for a one-off snapshot. Both methods preserve formatting.
Why can't I resize my table in Google Slides?
Tables have two resize modes: outer (resize the whole table) and inner (change individual row / column widths). Click the edge of the table to enter outer mode - you'll see corner handles. To resize one row or column, hover the divider line between cells until the cursor changes, then drag.
How do I merge cells in a Google Slides table?
Click the first cell, drag to select adjacent cells in a row or column, then right-click and pick Merge cells (or Format > Table > Merge cells). The selection becomes one cell. Useful for spanning headers across multiple columns. To unmerge, right-click the merged cell and pick Unmerge cells.
Can I sort rows in a Google Slides table?
Not directly - Slides tables have no sort feature. The workaround: build the data in Google Sheets first (where Sort by column works), then paste into Slides via Insert > Chart > From Sheets. The pasted version reflects the sorted Sheets data and updates if you re-sort the source.
How do I add a header row that stays visible while scrolling?
Slides tables don't scroll - the entire table fits on the slide. There's no fixed-header concept. For data that exceeds slide capacity, split into multiple slides with a repeating header row, or use Insert > Chart > From Sheets where the linked Sheet handles overflow naturally.
Can I export a Google Slides table to Excel?
File > Download > Microsoft PowerPoint (.pptx) preserves the table - PowerPoint reads it natively. From PowerPoint, you can copy the table and paste into Excel. Direct Slides → Excel isn't supported. For a cleaner path, build the data in Google Sheets and download Sheets as Excel - that's the canonical spreadsheet path.
How do I make a table transparent in Google Slides?
Select the cells you want transparent, then click Fill colour in the toolbar and pick Transparent (the diagonal-stripe icon at the top-left of the colour grid). The cell fill goes away, letting the slide background show through. Border colour stays - to remove, set Border colour to Transparent too.
Want a deck where every comparison table is already styled and aligned? Try Slidee - generate a complete presentation with auto-formatted data tables in 30 seconds.